Introducing ContentStudio Home with AI Studio built in — for faster, on-brand post creation Try now
The most important social media metrics to consider in 2025
Keeping up with social media metrics is a non-negotiable need resulting from social media’s evolution from a simple networking tool to a crucial business platform that drives brand awareness, customer engagement, and revenue growth.
In this comprehensive guide, we’ll explore the most important social media metrics to consider in 2025 and beyond, providing you with actionable insights to enhance your social media strategy and drive meaningful results for your business.
Let’s start with the basics!
What are social media metrics?
Social media metrics are quantifiable data points that measure the performance, reach, and impact of your social media ideas and activities across various platforms. These metrics provide valuable insights into how your content resonates with your audience, how effectively you’re achieving your marketing goals, and where opportunities for improvement exist.
From basic engagement rates to complex conversion tracking, social media metrics help transform abstract social media activities into concrete, actionable business intelligence.
Modern social media metrics go beyond simple vanity metrics like follower counts. Today’s most valuable metrics focus on meaningful interactions, authentic engagement, and direct business impact.
Why are social media engagement metrics important?
Social media engagement metrics serve as the heartbeat of your digital marketing strategy. These metrics reveal how your audience truly interacts with your brand, going beyond surface-level indicators to show genuine interest and connection.
Some of the key reasons why social media engagement metrics are important are:
- Build authentic relationships: Engagement metrics help you understand which content sparks meaningful conversations with your audience.
- Optimize content strategy: By tracking social media engagement metrics, you can identify patterns in your most successful content. Whether it’s video posts that generate more comments or carousel posts that drive higher saves.
- Analyze ROI and Business Impact: Engagement metrics bridge the gap between social media activities and business outcomes.
- Algorithm optimization: Social media algorithms prioritize content with high engagement, meaning these metrics directly influence your organic reach.
- Competitive advantage: Monitoring engagement metrics allows you to benchmark your performance against competitors and industry standards.
49 key social media metrics to track
Now that you know the basics of social media metrics, let’s look at the top 49 social media metrics across different categories of measurements, each providing unique insights into your performance.
Audience metrics
Identifying your audience is fundamental to social media success. These metrics provide insights into who your followers are, how your audience is growing, and the quality of your community.
1. Follower growth rate
This metric tracks the percentage increase in followers over a specific period. A healthy growth rate varies by industry but typically ranges from 1-3% monthly for established accounts. Here’s the formula:
Follower growth rate = (New followers ÷ Total followers) × 100
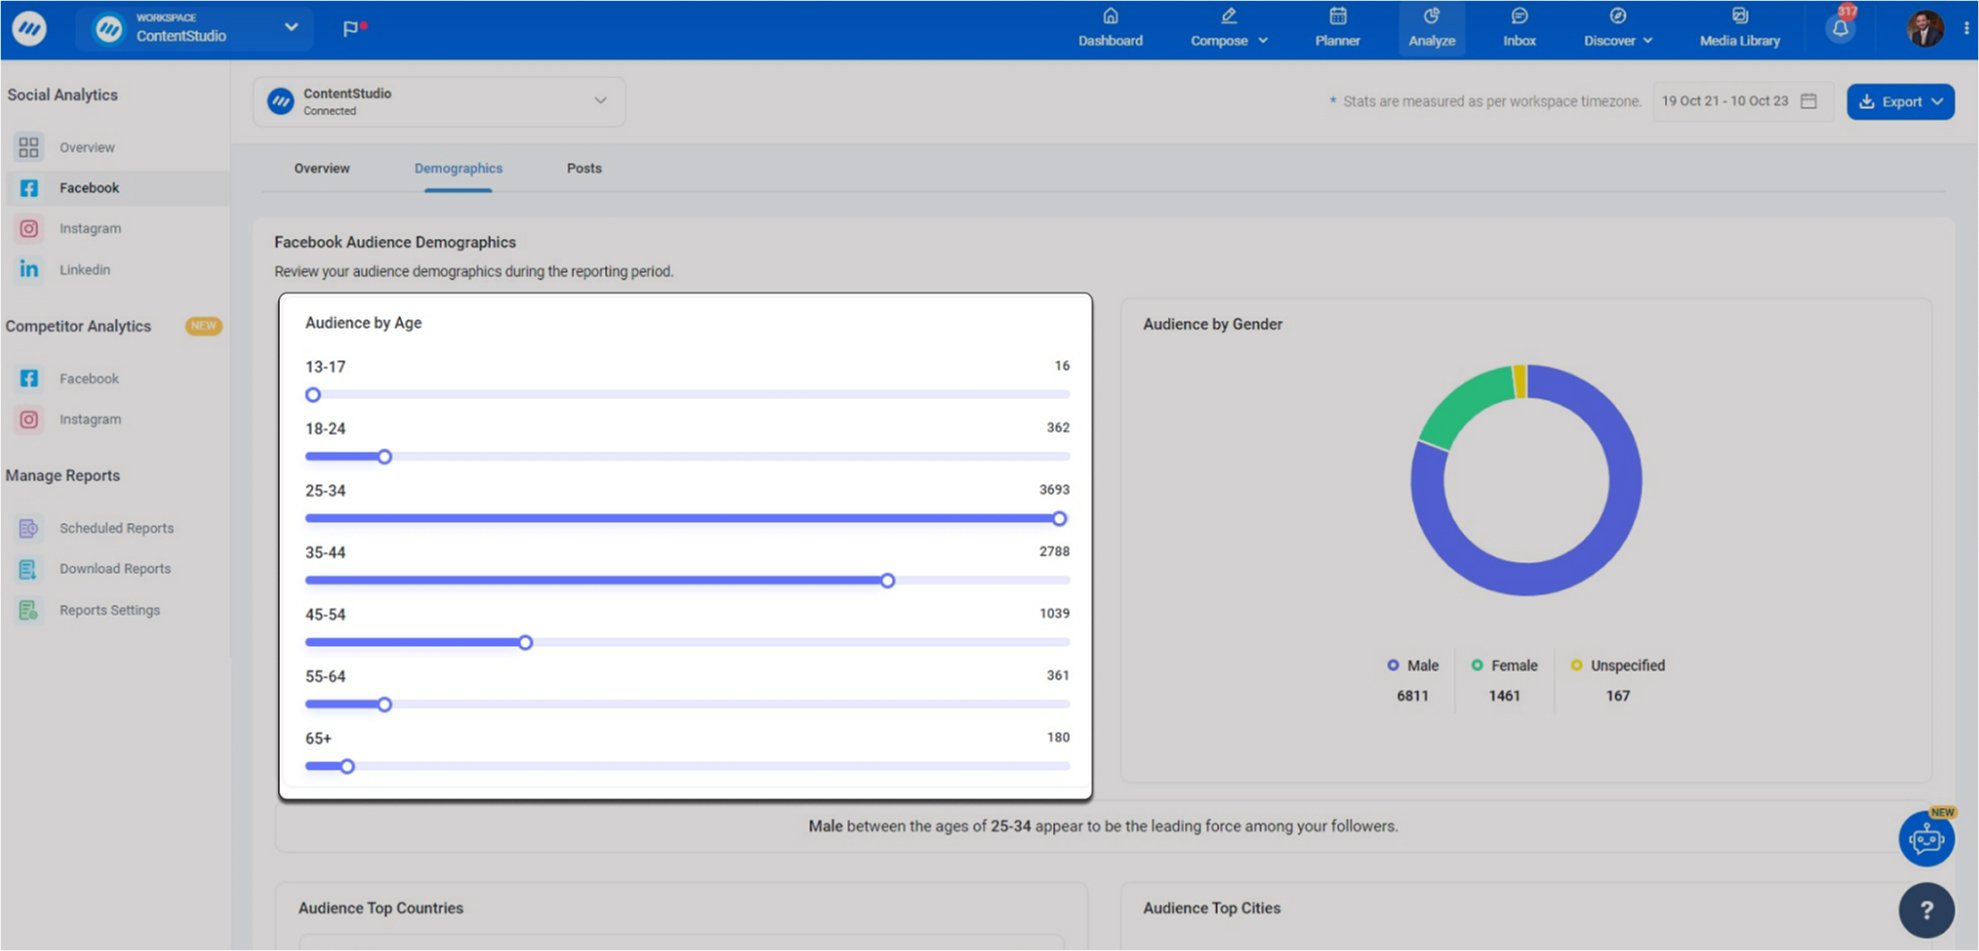
2. Audience demographics
Platform analytics provide detailed breakdowns of your audience’s age, gender, location, and interests. This information helps you create targeted content and optimize posting times for maximum reach.
3. Follower quality score
Beyond quantity, evaluate follower authenticity by monitoring engagement rates, profile completeness, and interaction patterns. High-quality followers are more likely to become customers and brand advocates.
4. Audience retention rate
This measures how many followers remain engaged over time versus those who unfollow or become inactive. A high retention rate indicates a strong content strategy and audience satisfaction. It can be calculated using the following formula:
Audience retention rate = (Followers at end of period ÷ Followers at start of period) × 100
5. Reach demographics
Understanding who sees your content versus who follows you reveals content discovery patterns and helps identify potential new audience segments to target.
Social media engagement metrics
Engagement metrics reveal how actively your audience interacts with your content, providing insights into content quality and audience interest levels.
6. Engagement rate
Industry benchmarks vary, but rates above 3% are generally considered strong. Understanding how to calculate social media engagement rate helps you benchmark your performance effectively. You can calculate it through the following formula:
Engagement rate = (Total engagements ÷ Total followers) × 100
Or alternatively:
Engagement rate = (Total engagements ÷ Total reach) × 100
7. Comments per post
Comments indicate deeper engagement than likes, showing that the content prompted meaningful responses. Monitor comment sentiment and respond promptly to build community. Here’s the formula:
Average comments per post = Total comments ÷ Total posts
8. Shares and saves
These actions demonstrate content value, as users are willing to associate your content with their personal profiles. Saves particularly indicate content users want to reference later.
9. Story engagement rate
For platforms with story features, track completion rates, replies, and story-specific interactions like polls and questions. Stories often have higher engagement rates than feed posts. The formula is simple:
Story engagement rate = (Story interactions ÷ Story impressions) × 100
10. Live video engagement
Monitor live streaming viewership, real-time comments, and post-live replay views. Live content typically generates 6x more engagement than regular video content. To calculate it, use the following formula:
Live engagement rate = (Live interactions ÷ Peak concurrent viewers) × 100
Social media performance metrics
Performance metrics measure the effectiveness of your content strategy and overall social media presence.
11. Reach and impressions
Reach shows unique users who saw your content, while impressions count total views. A high impression-to-reach ratio indicates content was seen multiple times, suggesting strong interest. Platform-specific insights like Instagram impressions and LinkedIn impressions provide a deeper understanding of content performance. Use the following formula to calculate your impression-to-reach ratio:
Impression-to-reach ratio = Total impressions ÷ Total reach
12. Organic vs. paid reach
Understanding the balance between organic and paid reach helps optimize budget allocation and content strategy. Organic reach continues to decline on most platforms, making quality content crucial. It can be easily calculated using the following formula:
Organic reach percentage = (Organic reach ÷ Total reach) × 100
13. Content performance by type
Track how different content formats (videos, images, carousels, and text posts) perform to optimize your content mix. Video content typically drives higher engagement across platforms.
14. Hashtag performance
Monitor which hashtags drive the most reach and engagement. Using hashtags strategically can significantly increase content discoverability.
15. Best posting times
Analyze when your audience is most active to optimize posting schedules. The best time to post on social media varies by platform and audience, with specific optimal times for Instagram, Facebook, LinkedIn, and TikTok.
Video performance metrics
Video content dominates social media engagement, making video-specific metrics essential for modern marketers.
16. Video completion rate
Track what percentage of viewers watch your entire video. Higher completion rates indicate compelling content that holds audience attention throughout. Here’s the formula for it:
Video completion rate = (Complete video views ÷ Total video views) × 100
17. Average watch time
This shows how long viewers typically watch your videos. Longer watch times signal quality content and improve algorithm performance on platforms like YouTube and TikTok. You can get your average watch time using the following formula:
Average watch time = Total watch time ÷ Number of viewers
18. Video engagement rate
Calculate engagement specifically for video content, including likes, comments, shares, and platform-specific actions like saves or downloads. It’s easy to calculate once you have the formula:
Video engagement rate = (Video engagements ÷ Video views) × 100
19. Click-through rate on video CTAs
If your videos include calls to action (CTAs), track how many viewers take the desired action. This metric directly ties video performance to business objectives. The formula is simple:
Video CTA click-through rate = (CTA clicks ÷ Video views) × 100
20. Video reach and impressions
Monitor how many people see your videos versus other content types. Video content often achieves higher organic reach due to algorithm preferences.
Social media marketing metrics
These metrics connect social media activities to broader marketing objectives and business outcomes.
21. Website traffic from social media
Use tools like Google Analytics to track how much traffic social media drives to your website. This metric demonstrates the value of social media in your overall digital marketing strategy.
22. Lead generation
Track how many leads originate from social media channels. This includes email signups, contact form submissions, and direct inquiries through social platforms. An effective social media marketing strategy integrates lead generation tracking across all touchpoints. It’s easy to calculate once you know the formula:
Social media lead conversion rate = (Leads from social media ÷ Social media visitors) × 100
23. Brand mention tracking
Monitor when and how your brand is mentioned across social platforms. Social media monitoring helps you understand brand perception and identify engagement opportunities.
24. Social media ROI
Calculate return on investment by comparing social media revenue to costs. This includes both direct sales and the value of leads generated through social channels. Advanced social media analytics tools help automate ROI calculations and reporting. Here’s the formula you can use to calculate your social media ROI:
Social media ROI = ((Revenue from social media – Social media costs) ÷ Social media costs) × 100
Conversion metrics
Conversion metrics measure how effectively social media drives desired business actions.
25. Conversion rate from social media
Track the percentage of social media visitors who complete desired actions on your website, such as making purchases or signing up for services. This metric directly ties social media efforts to business outcomes and helps justify marketing spend. Understanding performance reporting best practices ensures accurate conversion tracking. You can calculate your conversion rate easily using the formula below:
Social media conversion rate = (Conversions from social media ÷ Social media visitors) × 100
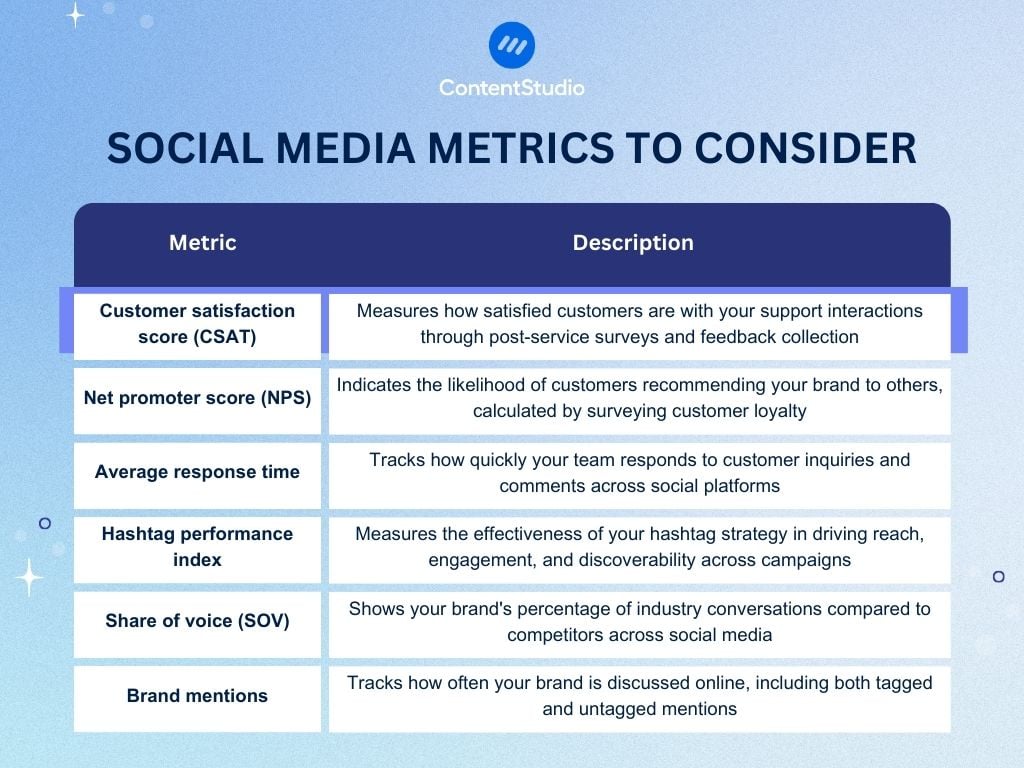
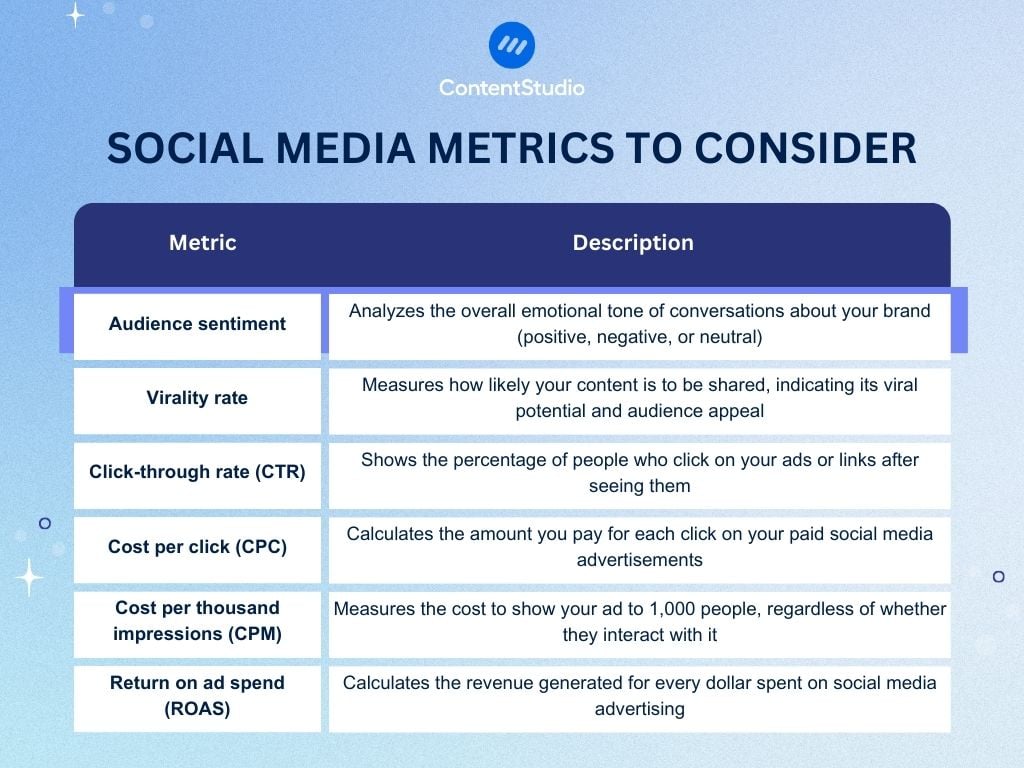
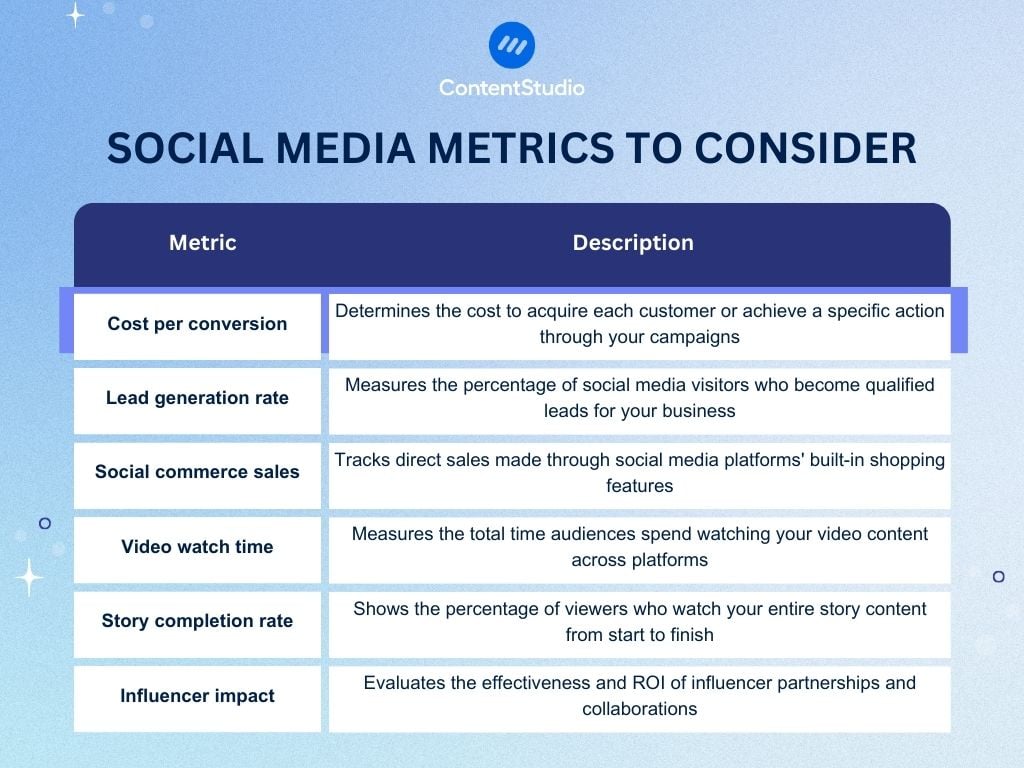
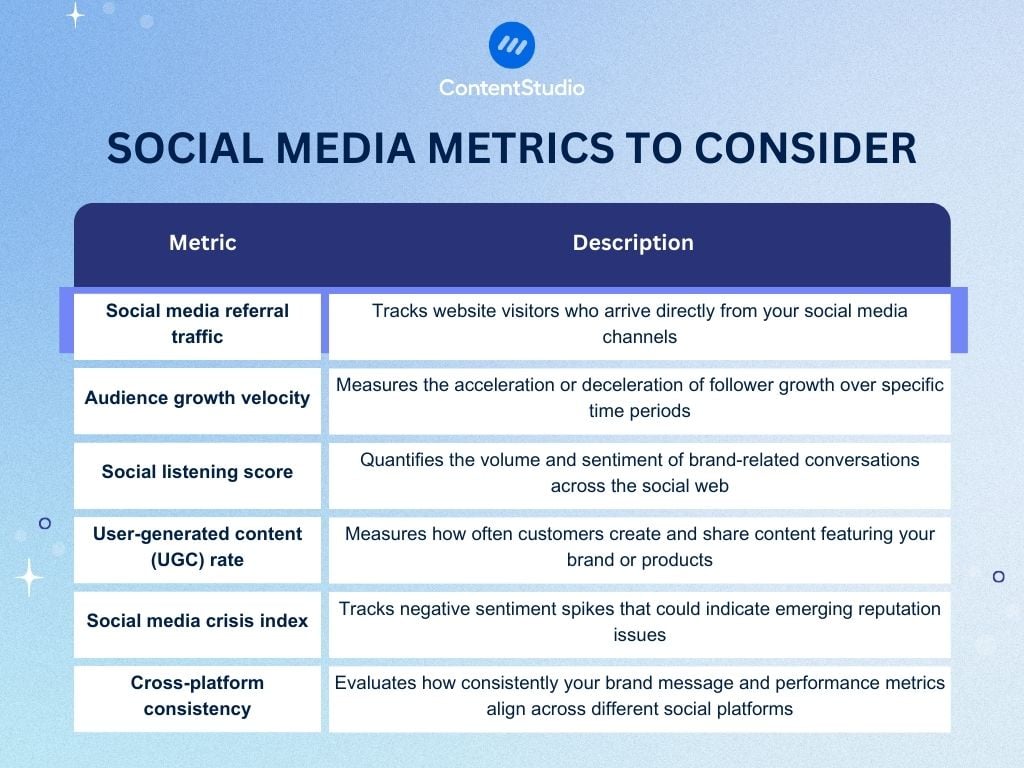
Additional social media metrics to consider
While the 25 metrics discussed above represent the most important social media metrics, there are several additional metrics that can provide valuable insights depending on your specific goals and industry.
We’ve listed 24 additional metrics that can enhance your social media measurement strategy below:
Utilize social media metrics to improve your strategy
Collecting social media metrics is just the beginning. You can get the maximum benefits when you transform that data into strategic improvements that drive measurable business results.
Here’s how leading brands turn metrics into competitive advantages.
Step 1: Establish your measurement foundation
Begin with baseline measurements for your core metrics over a 3-month period. This foundation reveals your natural performance patterns and helps identify what constitutes meaningful improvement versus normal fluctuations.
Step 2: Implement the 80/20 analysis approach
Focus on the 20% of content that drives 80% of your results. If Instagram carousel posts generate 5x more engagement than static posts but represent only 30% of your content mix, this presents a clear optimization opportunity.
Step 3: Create feedback loops
Set up weekly metric reviews that feed directly into content planning. When engagement drops on Tuesdays, investigate whether it’s timing, content type, or audience behavior driving the pattern.
Overall, the key to success lies in viewing social media metrics as a continuous feedback system rather than periodic report cards. This approach transforms social media from a creative exercise into a strategic business function that consistently drives measurable results and sustainable growth.
How to track social media metrics?
Effective tracking of social media metrics requires the right combination of tools, processes, and analytical frameworks. The complexity of modern social media demands systematic approaches that capture both quantitative data and qualitative insights across multiple platforms.
It is important to establish effective social media metrics tracking frameworks, set up conversion tracking, and create suitable reporting schedules.
Tools for tracking social media metrics
A lot of people wonder how to measure social media success. Well, there is a large variety of tools available for tracking social media metrics. Every tool has its own strengths and capabilities.
Native platform analytics
Every major social media platform provides built-in analytics tools. Instagram Analytics, Facebook Analytics, Twitter Analytics, and LinkedIn Analytics offer comprehensive data about your performance on their respective platforms.
Third-party analytics platforms
Comprehensive social media analytics tools like ContentStudio offer cross-platform analytics that provide unified reporting across multiple social networks. These tools excel at comparative analysis and trend identification across your entire social media presence.
Google Analytics integration
Connecting your social media efforts with Google Analytics provides deeper insights into how social traffic behaves on your website. Set up goals and conversion tracking to measure the complete customer journey from social media to final conversion.
How to track social media metrics with ContentStudio
ContentStudio.io provides a comprehensive solution for tracking social media metrics across all major platforms, offering advanced analytics capabilities that streamline measurement and reporting processes.
Here’s how to use ContentStudio’s analytics features for effective metric tracking.
Access ContentStudio’s analytics
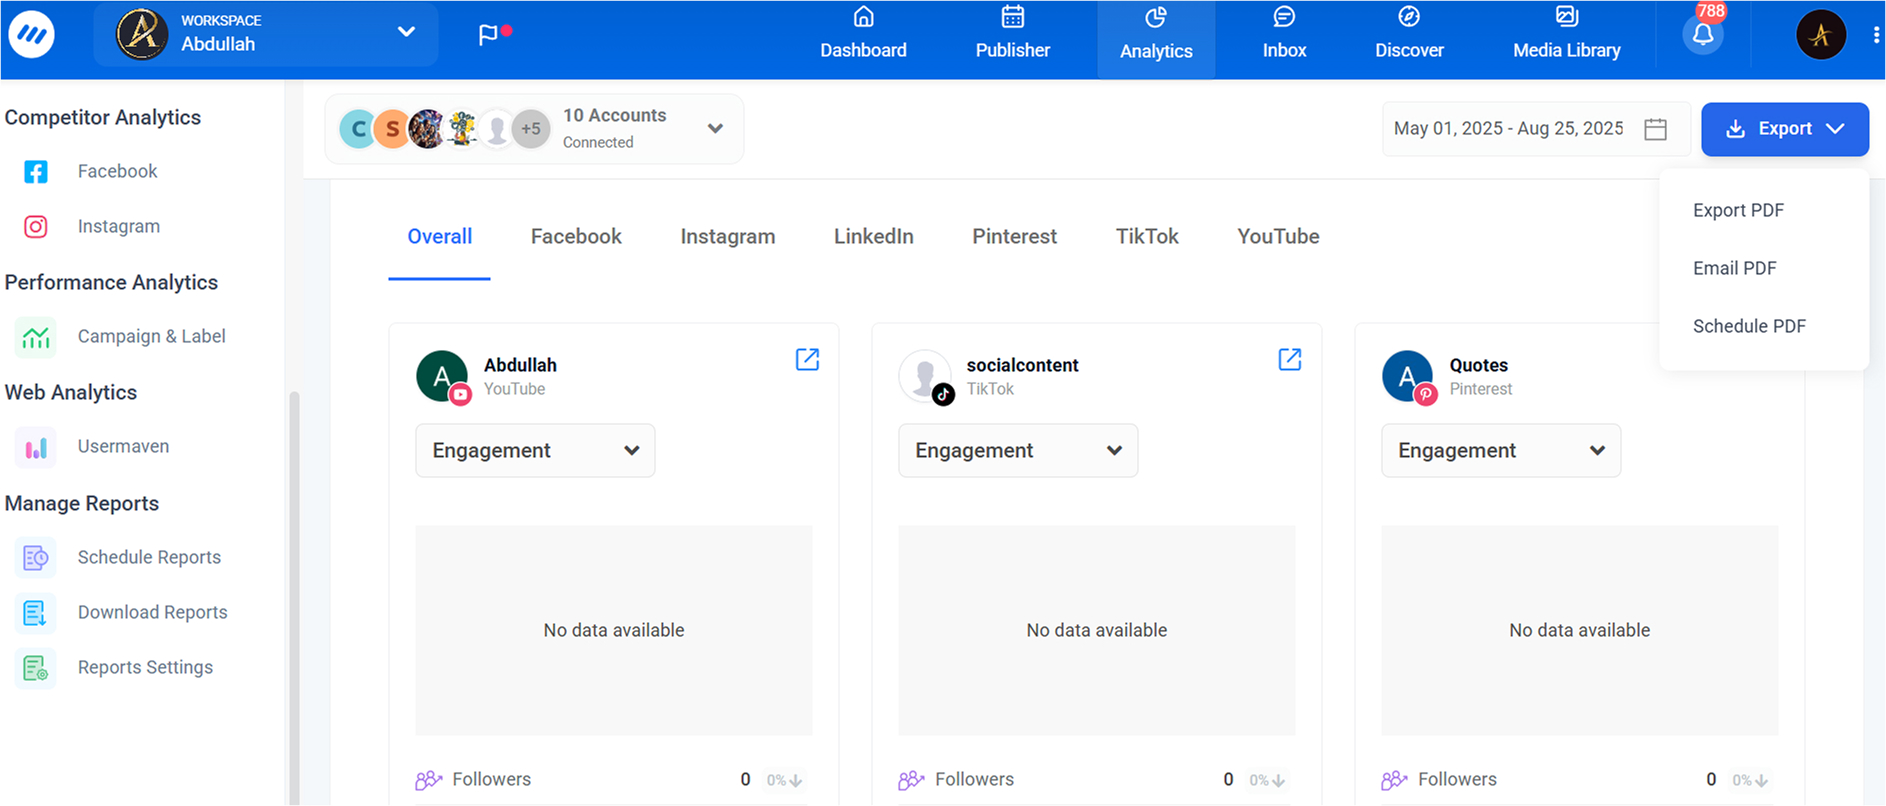
Navigate to the Analytics module from ContentStudio’s dashboard.
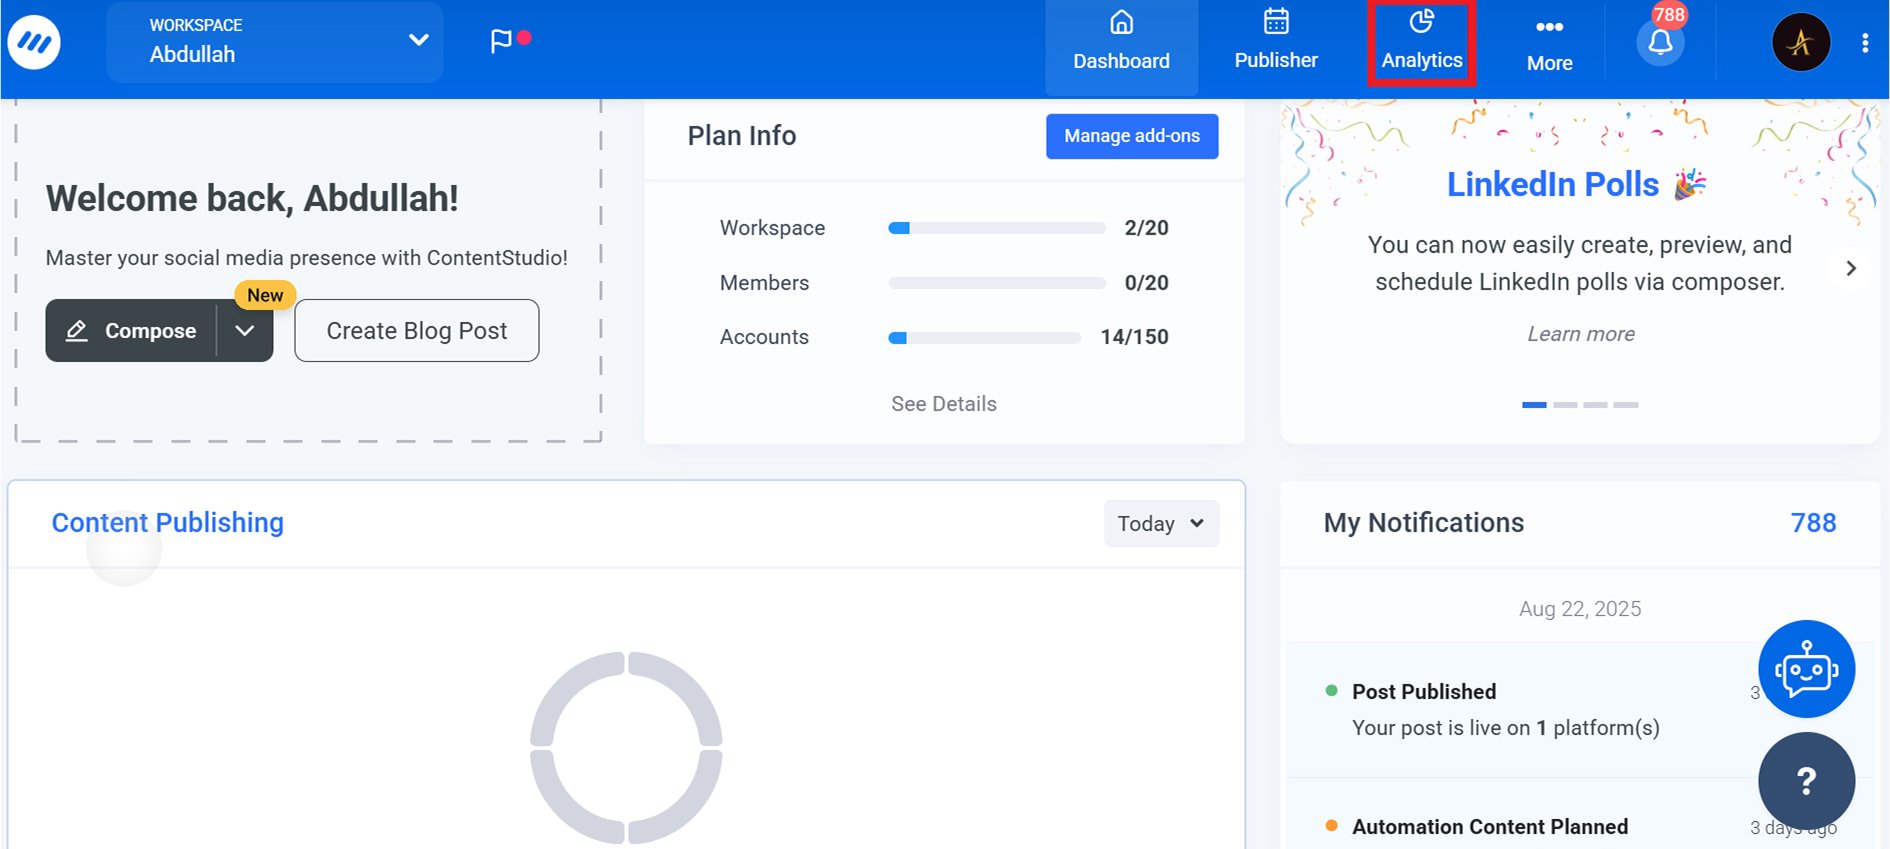
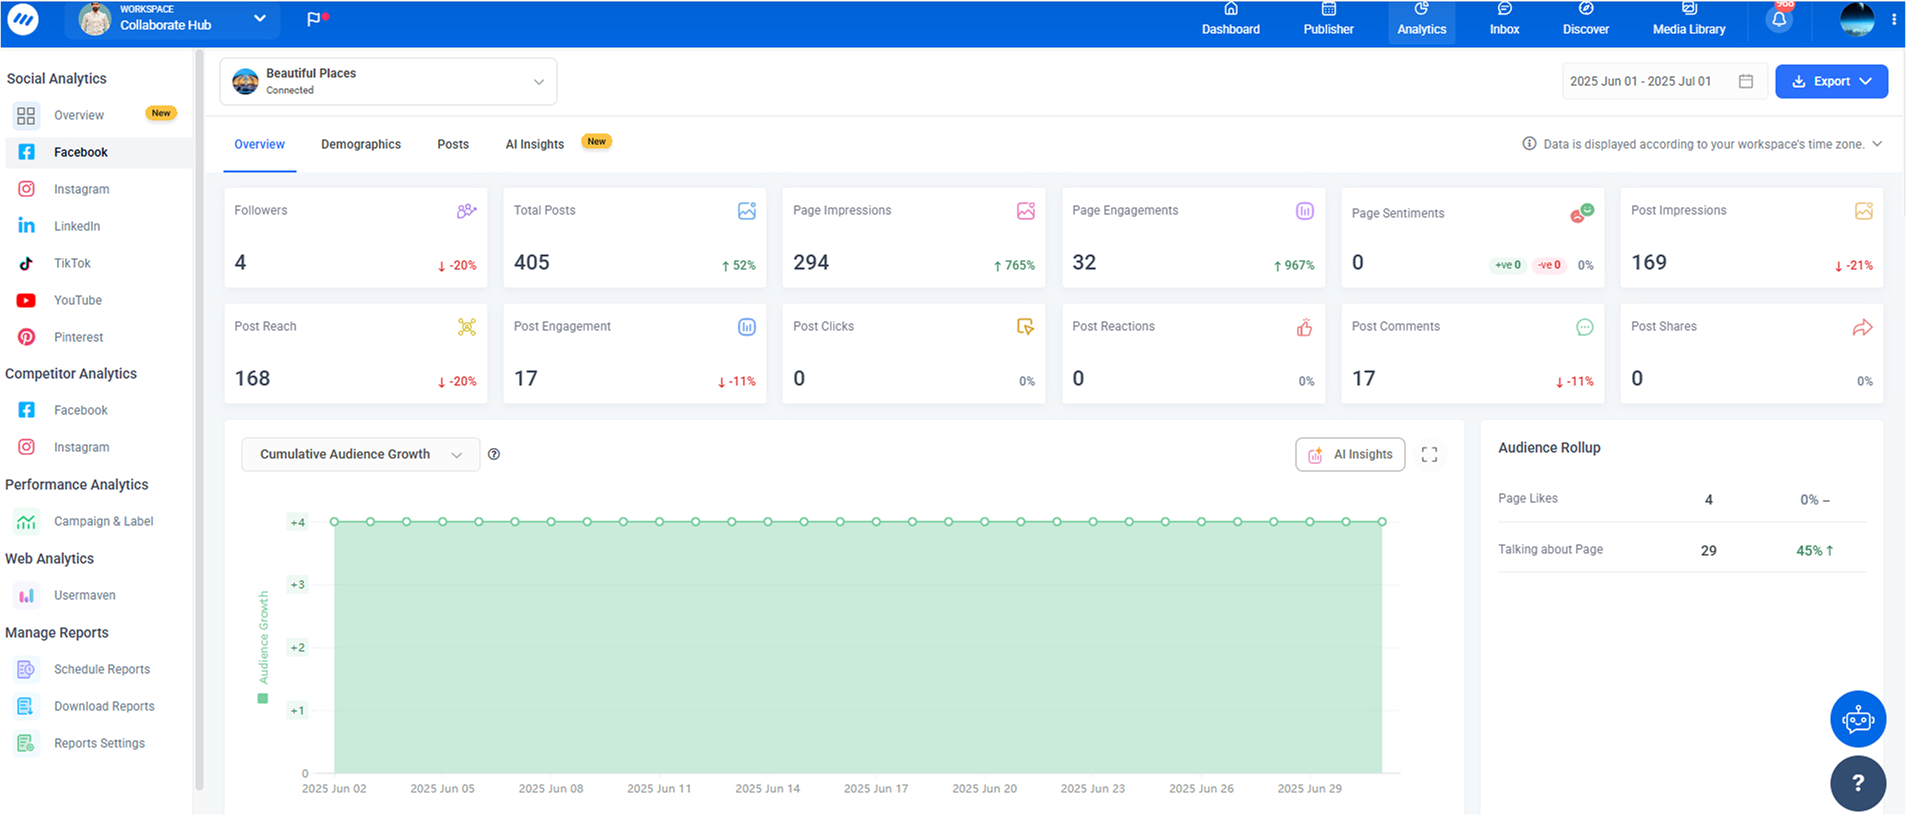
You select Overview under Social Analytics. Choose your accounts and date range (default: past 30 days). The dashboard displays interactive cards showing followers, posts, engagements, and impressions with percentage changes from previous periods.
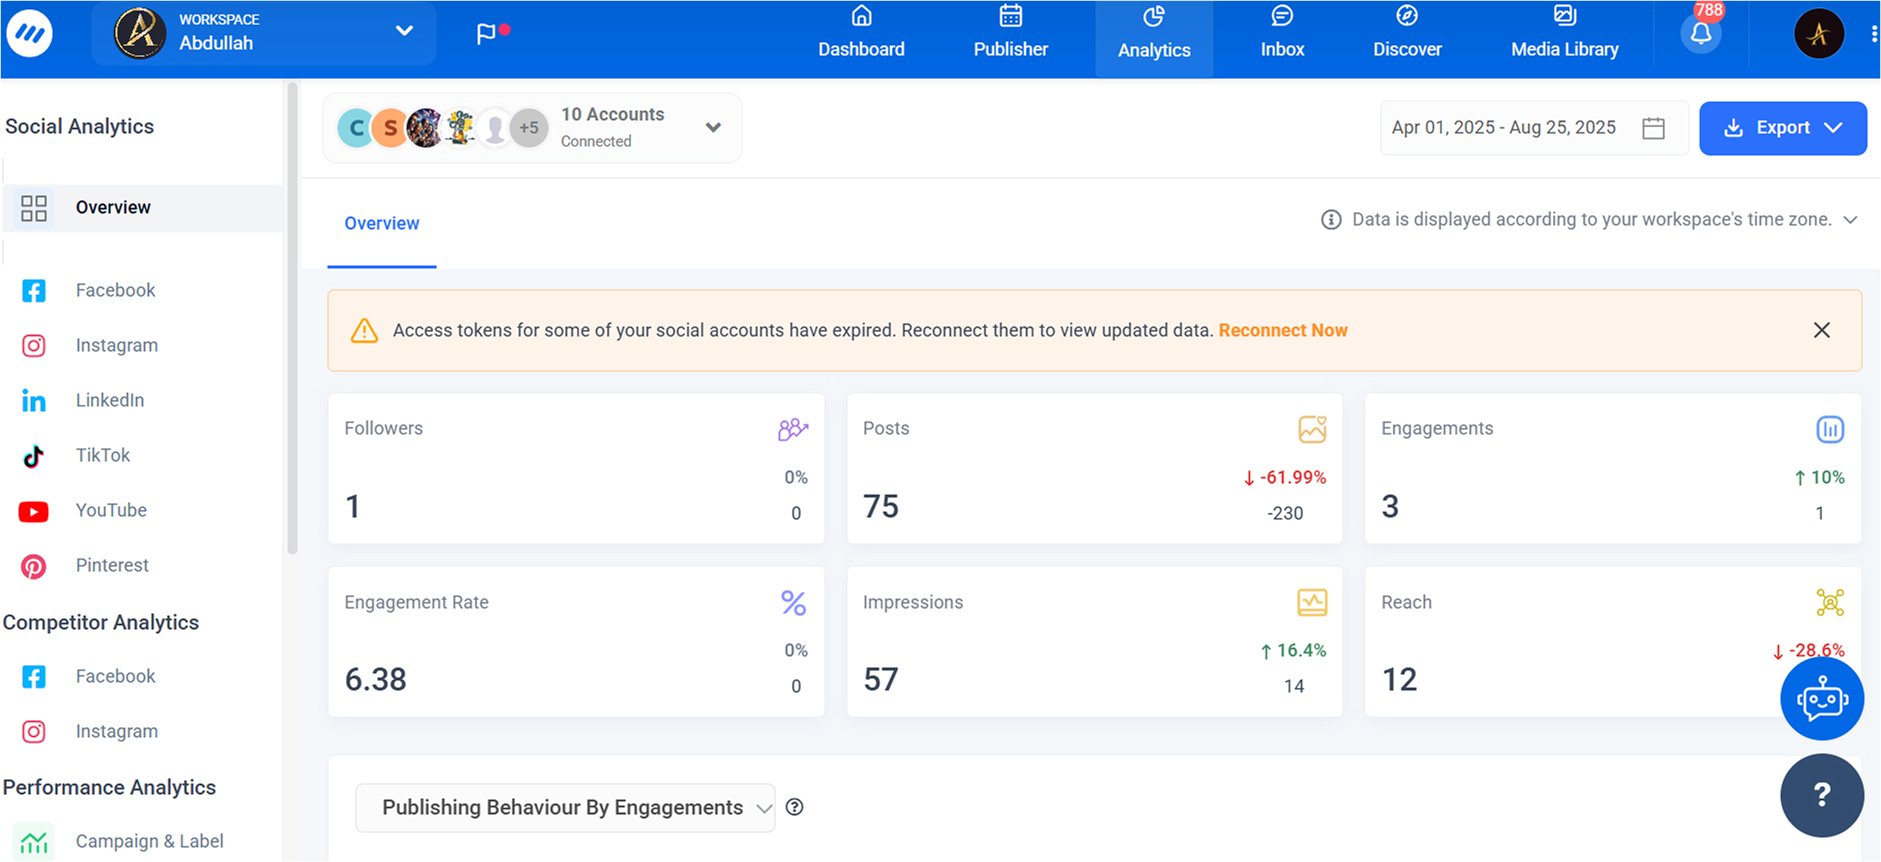
Track key social media metrics across platforms
Monitor essential metrics from Facebook, Instagram, X (Twitter), LinkedIn, YouTube, and TikTok in one place. Some of these key metrics are:
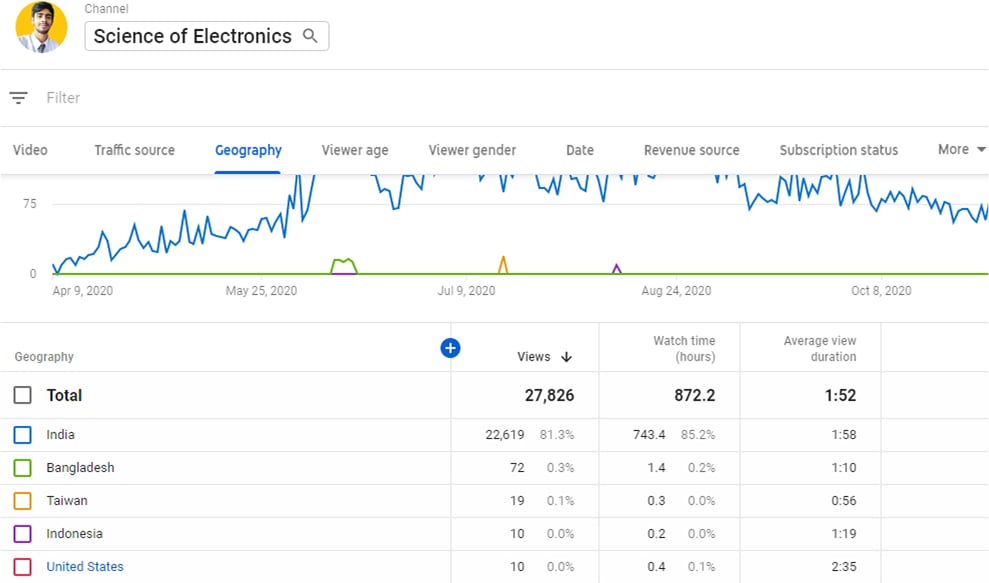
- Platform reach: Daily unique users across all channels with trend visualization
- Engagement breakdown: Likes, comments, shares by network and content type
- Performance comparison: Cross-platform and account comparisons
- Top posts: 5 highest-performing posts by reach, engagement, or impressions
You can get the data of each platform and account individually, or also see the overall metrics on all of your connected social media accounts.
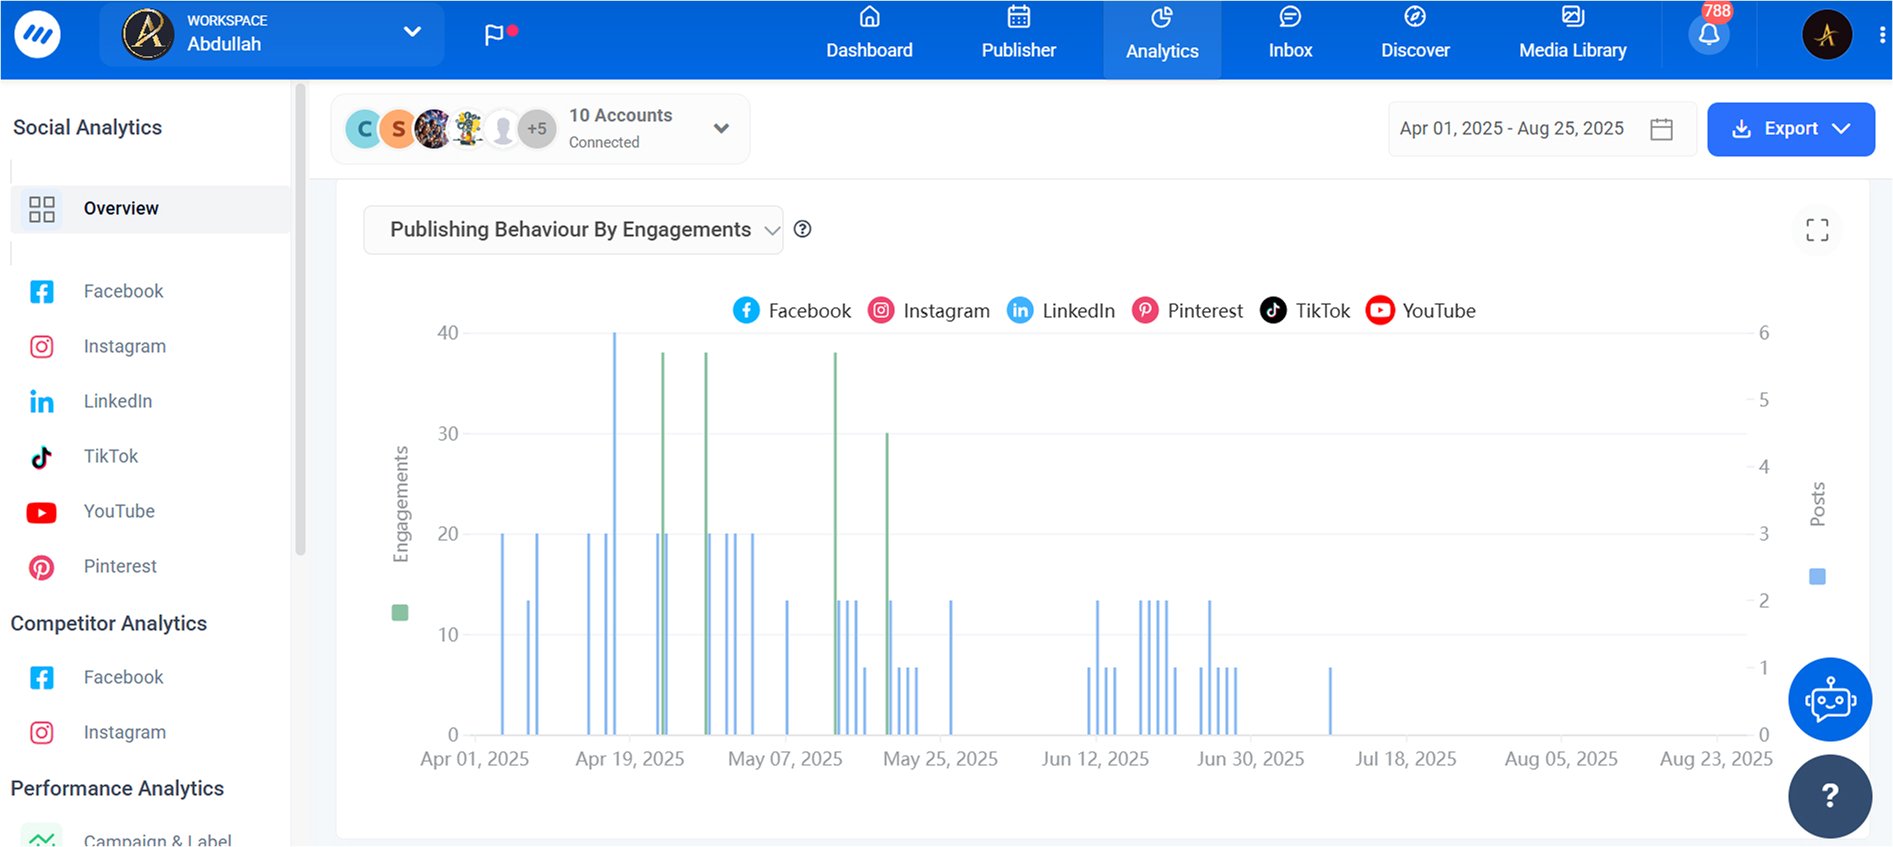
Use AI insights to refine your strategy
ContentStudio’s AI analyzes performance data to provide optimization recommendations:
- Pattern recognition: Identifies trends in engagement and audience behavior
- Content suggestions: Recommends optimal posting times, formats, and topics
- Performance predictions: Forecasts outcomes for different content strategies
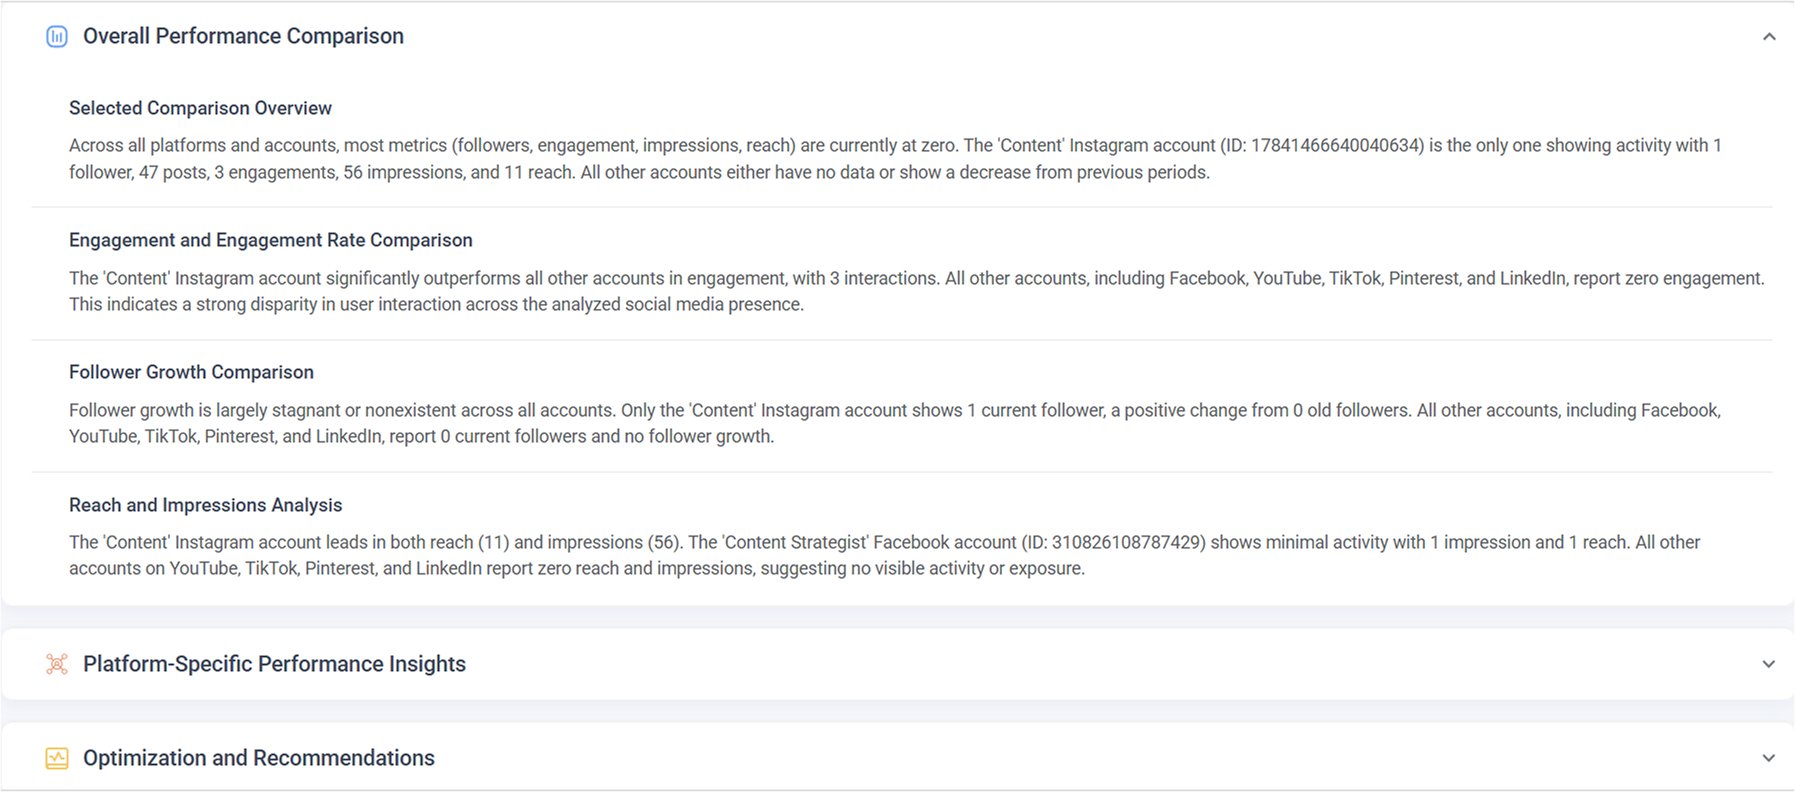
All you have to do is click on the AI Insights button in the relevant section, such as the engagement graph:
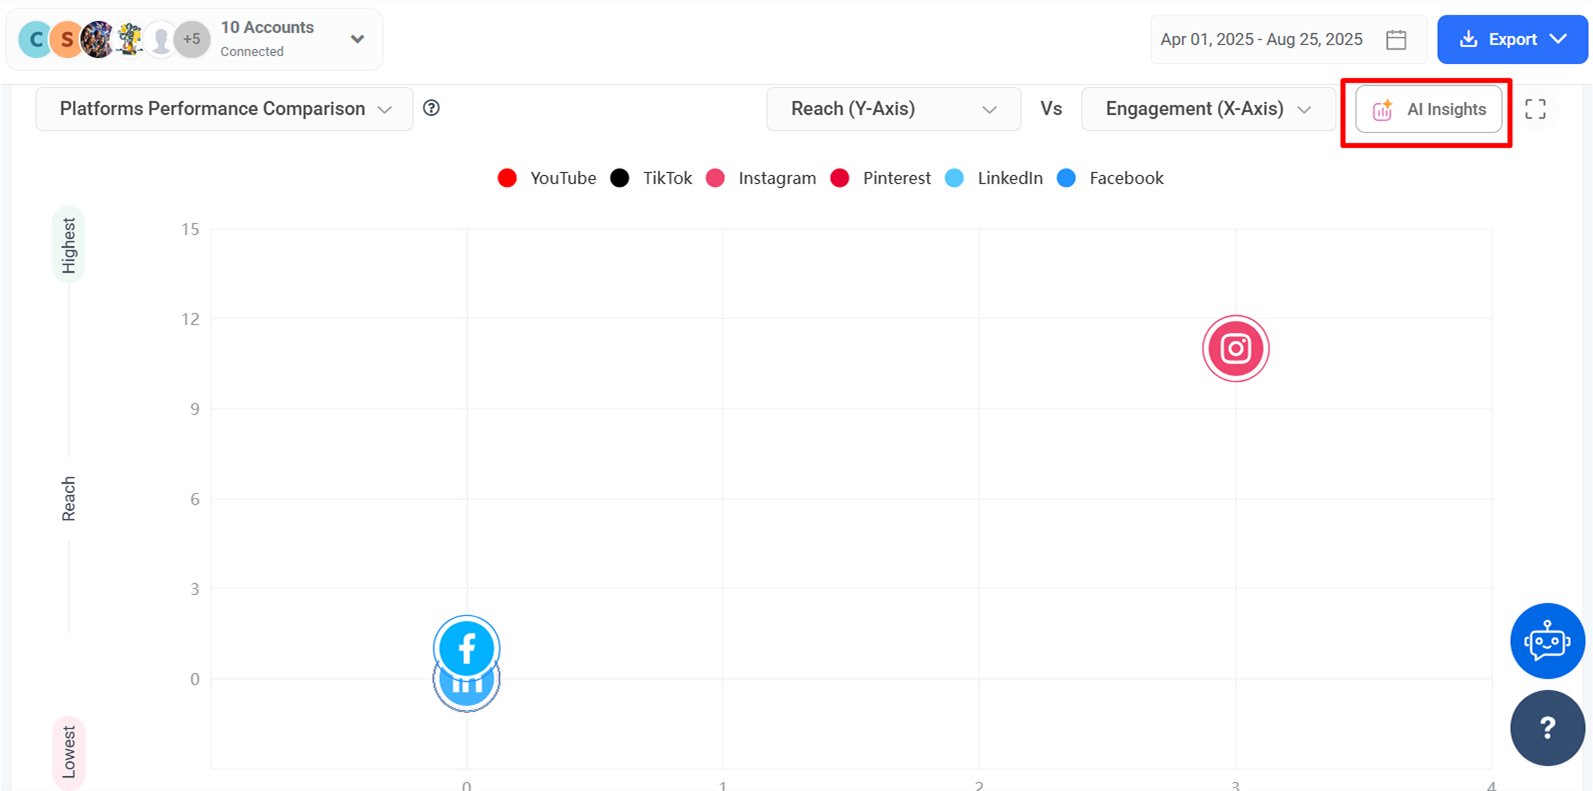
You will get detailed insights, including an overview, platform-specific information, and recommendations:
Automate and customize reports
Streamline reporting with automated features:
- Scheduled delivery: Daily, weekly, monthly, or quarterly automated reports
- Custom metrics: Select relevant metrics for specific audiences
- Multiple formats: PDF, Excel, and PowerPoint exports
Share reports and prove social media ROI
Communicate value effectively to stakeholders:
- ROI calculations: Connect social metrics to business outcomes
- Visual storytelling: Transform data into compelling narratives
- Benchmark comparisons: Include industry and competitor context
- White-label reporting: Brand reports with your identity
The comprehensive reporting capabilities help you move beyond simple metric presentation to strategic communication that drives business decisions and secures continued investment in social media marketing efforts.
Social Media Analytics
Fine-tune your social media strategy for success with in-depth analytics and white-labeled reports.
Get Started for FREE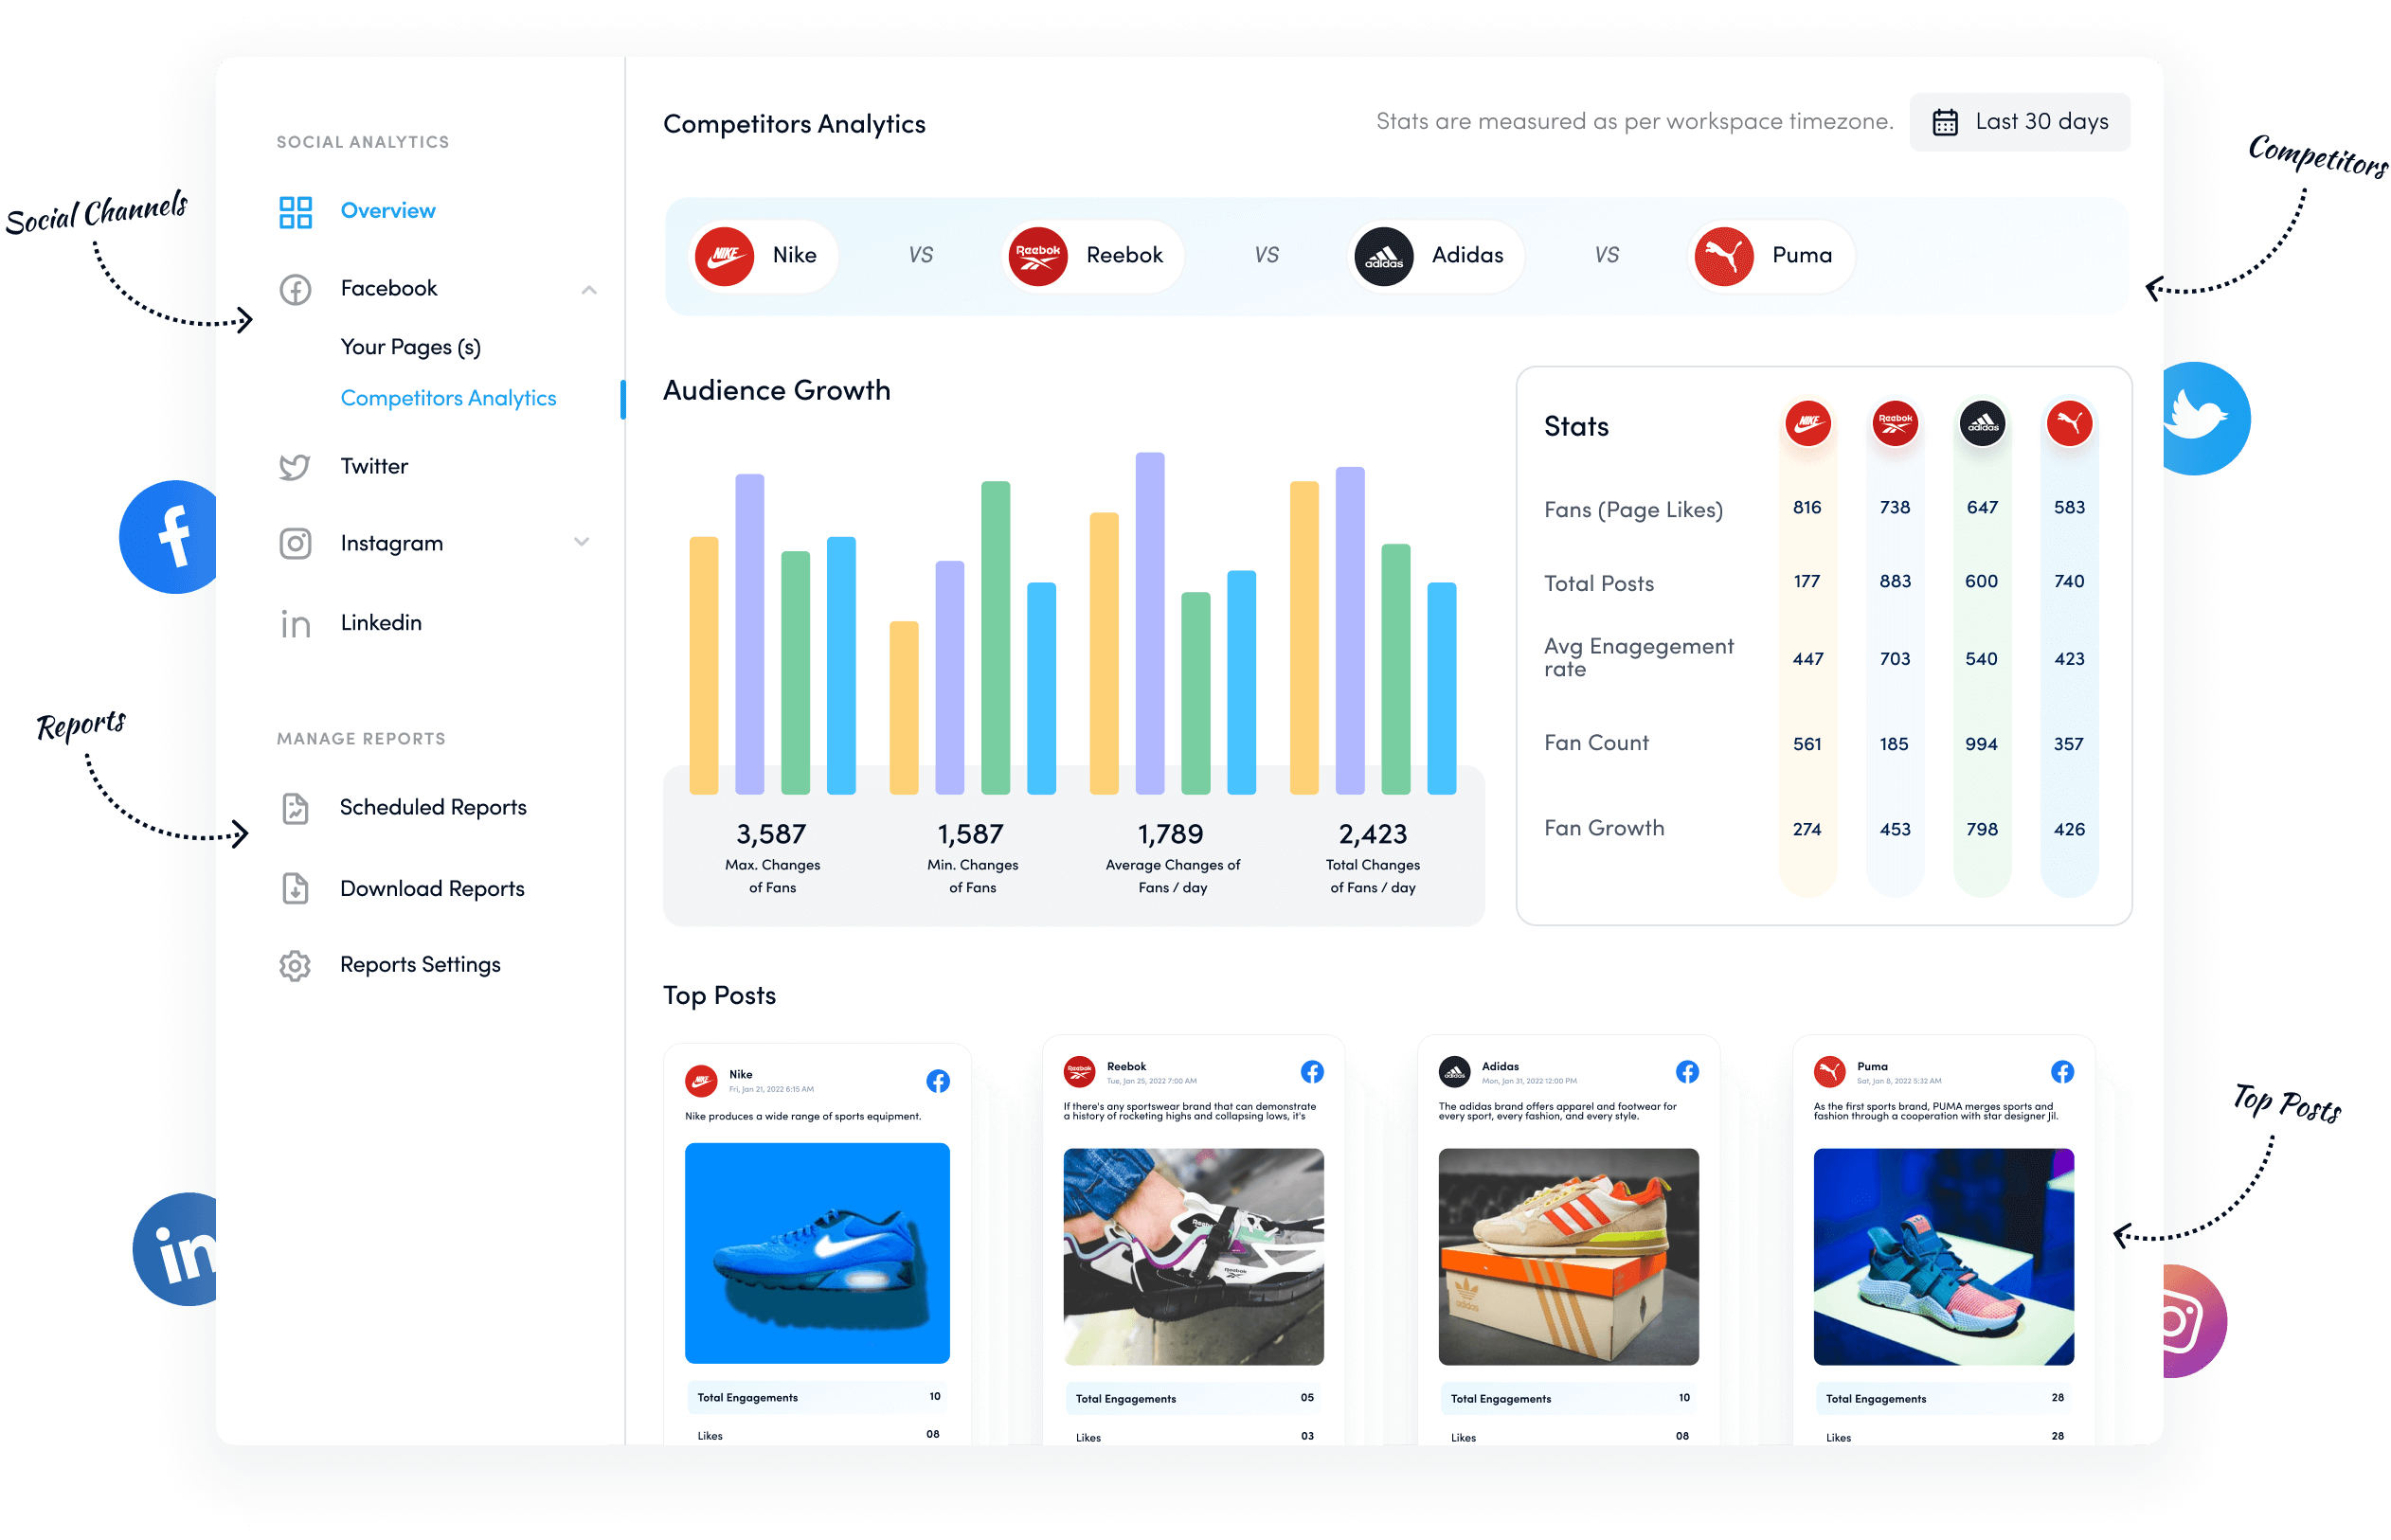
Conclusion
Mastering social media metrics in 2025 means tracking data that directly supports your business goals while enabling continuous optimization. As platforms and user behaviors evolve, you need flexible analytics that adapt with the landscape.
ContentStudio’s analytics dashboard simplifies this process by providing unified measurement and actionable insights. Ready to transform your social media strategy? Try ContentStudio and discover how data-driven decisions can revolutionize your results.
FAQs
What are social media metrics?
Social media metrics are measurable data points that track your performance across platforms, such as engagement rates, follower growth, reach, clicks, and conversions. They help you understand how effectively your social media strategy achieves your marketing goals.
How to track social media metrics?
Track metrics effectively by combining native platform analytics with third-party tools and consistent reporting. Define clear objectives, select metrics that align with your business goals, and implement uniform measurement across all channels.
How are social media metrics and social media goals related?
Social media metrics measure progress toward your strategic social media goals. Your goals determine which metrics to track, while metric data helps refine future objectives by creating a continuous feedback loop for improvement.
What are the most important social media metrics?
The most important metrics are engagement rate, reach, conversion rate, follower growth rate, and social media ROI. These five metrics reveal audience interaction, content visibility, business impact, community growth, and financial returns.
How to measure social media success?
Measure success by tracking metrics aligned with your business goals. Focus on reach and impressions for brand awareness, or engagement rates and follower growth for community building.
Recommended for you


Control every step of your workflows with the n8n ContentStudio Automation


Powerful social media management software
14-day free trial - No credit card required.